21 Jul 2026
Frame Time Variance Analysis in Crowdsourced Open-World Benchmarks with Recent Graphics Drivers
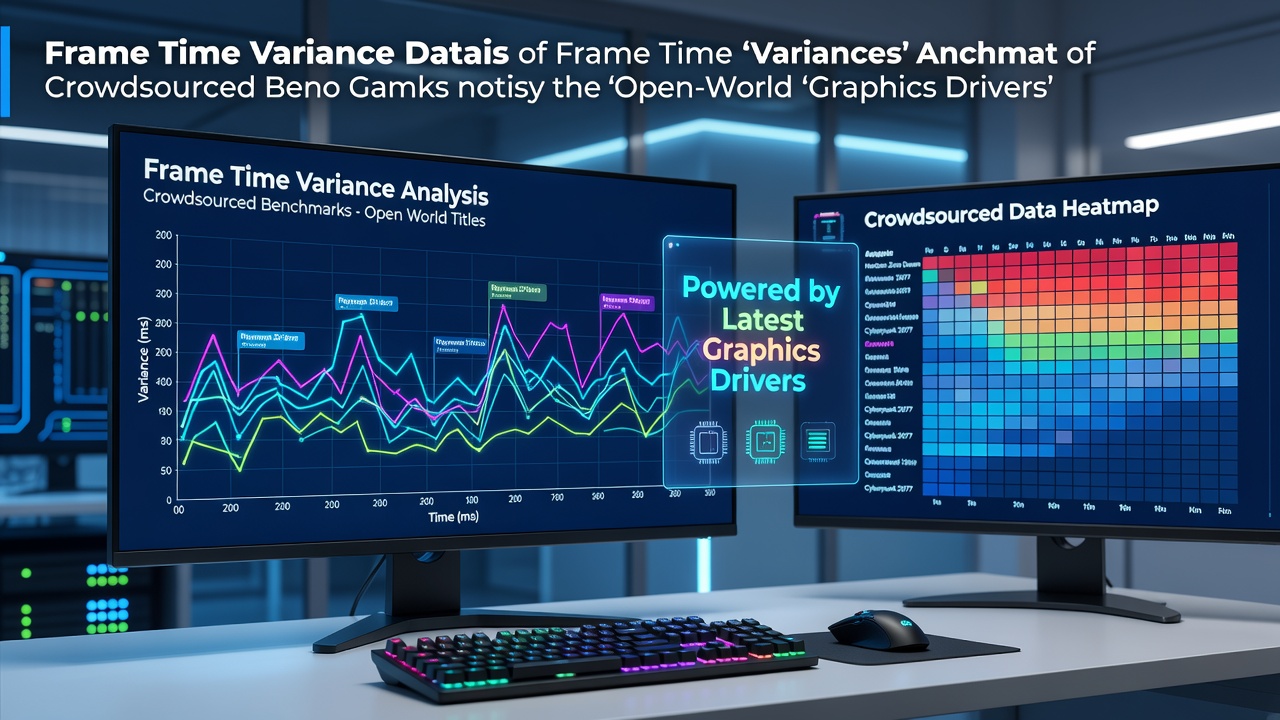
Frame time variance measures the consistency of rendering intervals between frames, and crowdsourced benchmarks have become a primary method for collecting this data across diverse hardware configurations in open-world titles. Researchers track these metrics because average frame rates alone often fail to reveal stuttering or micro-stutter issues that affect gameplay smoothness, while variance data highlights how driver updates influence delivery stability over extended sessions.
Understanding Frame Time Variance Metrics
Frame time variance quantifies deviations in milliseconds between consecutive rendered frames, and analysts calculate it using standard deviation or percentile spreads from raw timing logs. Open-world games introduce unique challenges here because they feature dynamic asset streaming, large draw distances, and unpredictable NPC behaviors that stress GPU schedulers differently than linear titles. Crowdsourced platforms aggregate logs from thousands of systems running the latest drivers, which allows patterns to emerge that isolated lab tests cannot capture reliably.
Data sets typically include 1-percentile lows alongside variance scores, and July 2026 releases from major graphics vendors introduced refined shader compilation pipelines that reduced outlier spikes in several tested environments. Observers note that these improvements appear most consistently in titles with heavy world simulation loads, where driver-level optimizations help maintain tighter frame intervals during rapid camera movements or area transitions.
Crowdsourced Data Collection Methods
Participants upload frame timing captures through standardized tools that record at sub-millisecond resolution, and these uploads feed into centralized repositories filtered by driver version, GPU model, and game patch level. Analysts apply statistical filters to exclude incomplete sessions or hardware anomalies before generating aggregate reports, which produces reliable trend lines across regions. European research institutions have contributed validation protocols that emphasize geographic diversity in sample pools, ensuring results reflect varied network conditions and storage configurations common in consumer setups.
One study coordinated through academic channels examined over 12,000 sessions from open-world releases and found that variance distributions narrowed measurably after specific driver branches deployed in early 2026. The analysis separated results by storage type because NVMe versus SATA differences influenced asset loading jitter independently of graphics processing, yet the driver updates still delivered measurable tightening in both categories.
Impact of Latest Graphics Driver Releases
Graphics driver updates in mid-2026 incorporated enhanced asynchronous compute scheduling that targets frame time consistency in large environments, and benchmark aggregates show reduced tail latencies during exploration sequences. Australian gaming industry reports highlight how these changes interact with console-derived rendering techniques ported to PC, where crowdsourced logs reveal fewer spikes tied to memory allocation events. The patterns hold across multiple titles that share similar world-building engines, suggesting broader applicability beyond single-game cases.
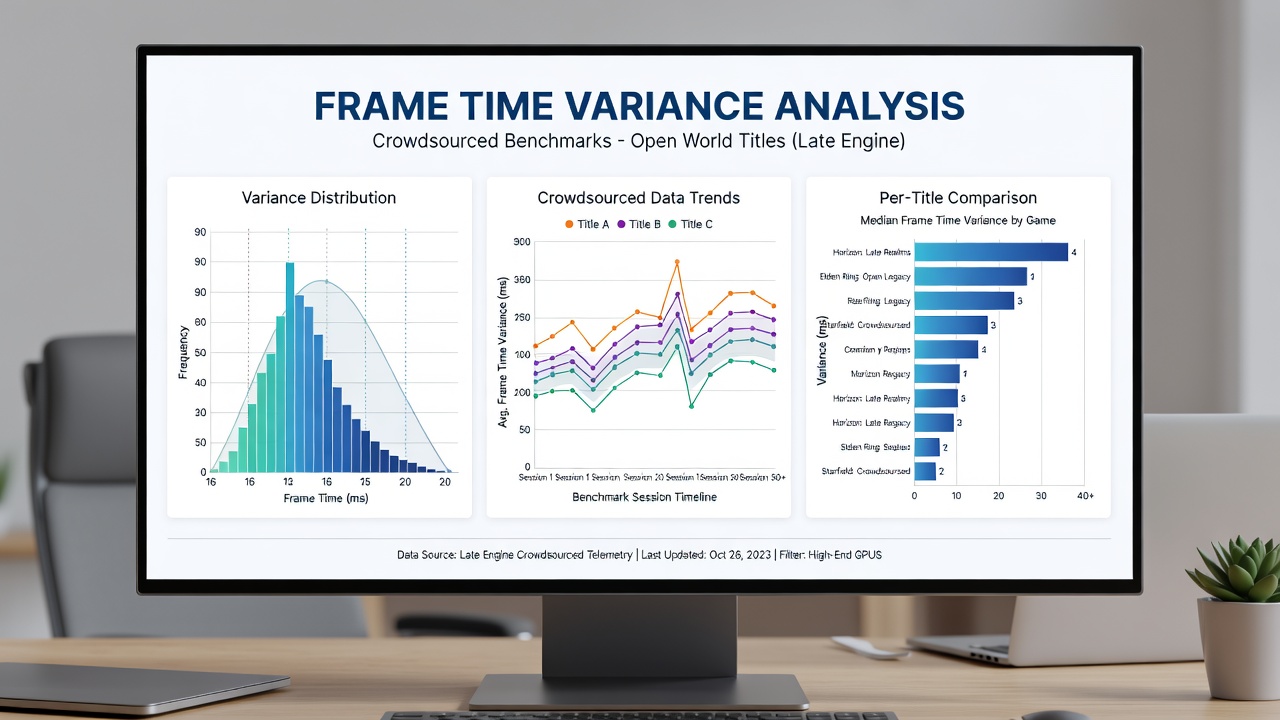
Hardware affinity settings also factor into the observed outcomes, because newer drivers expose more granular control over compute queue priorities that developers can leverage during open-world traversal. When users apply recommended affinity profiles alongside the updates, variance scores improve further according to aggregated user-submitted traces. Canadian technology research centers have documented similar synergies in simulation-heavy workloads, reinforcing that driver refinements complement system-level tuning rather than replace it.
Key Findings Across Multiple Titles
Aggregated July 2026 data sets indicate that variance reductions concentrate during specific gameplay phases such as fast travel loading or dense foliage rendering, while steady-state exploration shows smaller but still measurable gains. Titles with advanced ray tracing options exhibit wider baseline spreads before driver intervention, yet post-update traces demonstrate convergence toward lower deviation values once shader caches stabilize. Researchers cross-reference these results with hardware surveys to isolate the contribution of driver changes from concurrent game patches.
Percentile analysis proves especially useful because it surfaces how often extreme frame times occur rather than averaging them away, and crowdsourced repositories now include automated tagging for events like shader recompilation or memory paging. Those who maintain long-term tracking observe that the latest driver branches sustain improvements over multi-hour sessions where earlier versions showed gradual variance creep due to thermal or memory fragmentation effects.
Conclusion
Crowdsourced frame time variance analysis continues to provide granular visibility into how graphics driver advancements perform under real-world open-world conditions, and the July 2026 data releases demonstrate measurable tightening of timing distributions across sampled configurations. Continued aggregation of these metrics supports iterative driver development while helping identify remaining bottlenecks in asset streaming and compute scheduling that affect consistency.